
Talking Taxes in a Truck Episode 50: The War on Pass-Throughs
Is pass-through taxation a giant loophole that steals money from the Federal government? A growing chorus Academics and journalists seem to think so. Does this new tact reflect an underlying reality or is it just the latest set of flawed talking points?
To find out, we’re joined by longtime ally George Callas, founder of the Callas Strategy Group and a DC tax policy veteran. George and Brian identify the questionable assumptions, outdated data, and misleading narratives underlying these claims. They also revisit the 1986 tax reform and explain why the rise of pass-through businesses are the solution to income inequality, not the cause of it.
Show Notes:
- Callas Strategy Group: https://georgecallas.com/
- Plucking the Golden Goose Substack: https://georgecallas.substack.com/p/welcome-to-plucking-the-golden-goose
- S-Corp on Auten & Splinter’s work: https://s-corp.org/2022/03/tax-hike-premise-takes-another-hit-debunking-saez-zucman-income-inequality-narrative/
- Washington Wire – Old Study, Same Bad Conclusions: https://s-corp.org/2026/10/old-study-same-bad-conclusions/
Two Maps, One Reality
Earlier we highlighted research showing how well the United States is doing compared to Canada. Starting in a similar place forty years ago, today’s American worker earns more and benefits from significantly higher levels of business investment. It’s a gap that is large and growing.
Today we’ve got another geography-based point to make, courtesy of the Wall Street Journal and economists Eric Zwick and Owen Zidar (both of whom spent their formative years getting called last during roll call). Their book “The Everywhere Millionaire” reviewed America’s growing ranks of job creators and discovered the American Dream is alive and well:
Across America, such business owners, we call them Everywhere Millionaires, have built extraordinary fortunes running ordinary businesses. Some launched their own ventures, working long hours and reinvesting the profits to stay afloat and grow. Others inherited a family firm and built upon the success of prior generations.
How many? Zwick and Zidar estimate there are three million of them, collectively worth more than $65 trillion. These are veterinarians, HVAC contractors, and restaurant owners. Nearly half of the nation’s $31 trillion in private business equity resides in what the authors call “tactile, Main Street industries,” businesses where something needs to be “physically moved, or get fixed, served or installed.”
The geography here is striking. The Journal’s map uses Zwick and Zidar’s data to show average pass-through income among upper-income filers on a county-by-county basis. The wealth isn’t confined to a handful of coastal enclaves. It stretches across the country, with Walker County, Alabama topping the map at an average $1.9 million.
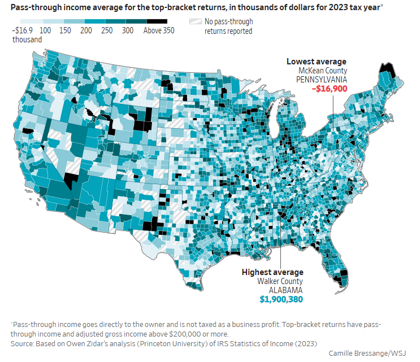
Look familiar? It should. Several years ago we asked EY to map employment at private companies across the country. The result was equally striking. Outside a relatively small number of coastal and urban areas, private companies dominate the employment base.

Combine the two maps and you get a pretty good picture of the Main Street economy. Private businesses provide the majority of jobs in this country — nearly four out of five. Our EY map shows those jobs are widely dispersed across the country, while the WSJ map shows the same goes for the wealth they generate – it’s spread across communities far removed from the usual financial and technology hubs.
The examples bear that out. Dick Portillo turned an $1,100 hot dog stand outside Chicago into a billion-dollar business. A.B. Walters built a gutter manufacturer in Natchez, Mississippi. Arch “Beaver” Aplin III built Buc-ee’s in Texas.
In recent weeks, we’ve seen a wave of proposals to raise taxes on these businesses – here, here, and here – often accompanied by the mischaracterization that the targets are primarily “law firms and hedge funds” whose income is unearned and whose wealth resides in an off-shore bank account somewhere far away.
The “Everywhere Millionaire” makes clear just how false that narrative is. The income came after decades of hard work, and the wealth is right here in the communities where we all reside and work. That’s the reality of wealth in America, and the reason voters need to reject efforts to tax wealth, these businesses, and your job into oblivion.
Old Study, Same Bad Conclusions
A decade ago, Treasury published a paper on effective tax rates that was worth a hard look. As our write-up showed, the headlines generated by the paper were not justified by its actual findings.
We’re republishing that response today because the original Treasury paper is back in the news – it’s cited in a recent NYU-Hamilton paper on pass-through businesses and two of its authors also co-authored the “Everywhere Millionaire,” a book which – as we explained the other day – is generating similarly misguided news coverage today.
New Treasury Effective Rate Study
Economists at the Department of Treasury and NBER last week released a paper reviewing the average taxes paid on business income, by entity type. We went through a similar exercise several years ago (you can read our study here), so we printed up a copy and took a look.
Here’s the headline graph:
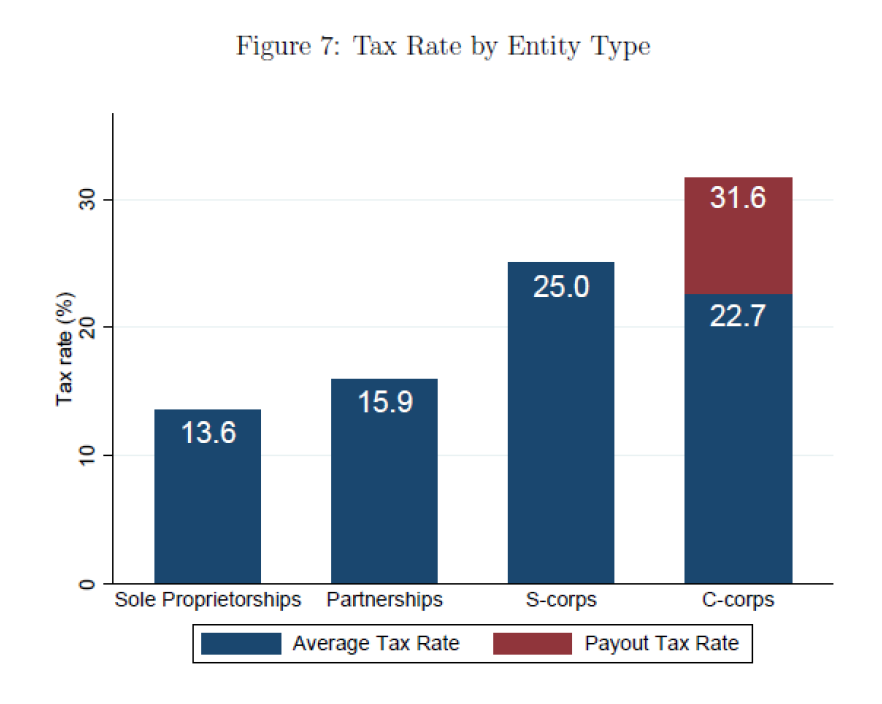 As you can see, the average tax rates for S corporations and C corporations are in the same basic range, while the averages for sole proprietorships and partnerships are significantly lower. The lower partnership average, coupled with the paper’s obvious emphasis on income inequality and the prospect of new revenues has garnered the majority of the press surrounding the paper’s release.
Below we itemize our initial thoughts regarding the substance of the paper and the quality of the estimates. But let’s face it—those items are secondary to the real point of the paper, which is to drive headlines like these:
“Pass-throughs to blame for income inequality?” — Politico
“Corporate ‘Pass-Throughs’ Have Cost the Treasury $100 Billion” – The Fiscal Times
Those headlines are based on the paper’s abstract and the general write-up, which emphasizes two basic points:
- The pass through structure contributes to income inequality; and
- Treasury would collect $100 billion more a year in revenues if C corporations were still the dominant entity type, as they were pre-1986.
The first point was summarized neatly in a Politico blog post last week:
PASS-THROUGHS TO BLAME FOR INCOME INEQUALITY? A new report by a group of Treasury Department economists and academics says the rise of business pass-throughs is a major contributor to income inequality. Pass-throughs paid an average tax rate of just 19 percent in 2011, the analysis found, compared with the 31 percent rate paid by traditional corporations. At the same time, their income accrued disproportionately – 69 percent – to the top 1 percent. “As is well-known, the top-1 percent income share doubled (from 10 percent to 20.1 percent) between 1980 and 2013,” the report said. “Less well-known is that over half (56 percent) of that increase came in the form of higher pass-through business income.”
Both Treasury and Politico have it exactly backward. Pass through taxation doesn’t add to “income inequality.” C corporation tax treatment masks it. This is something we have written about in the past.
Take Warren Buffett. He owns a large share of Berkshire Hathaway. That corporation pays no dividends and Buffett never sells any stock, so if one was just looking at the tax rolls, Buffett’s reported income is relatively low despite the fact that he’s one of the richest men on the planet. All his income is effectively hidden within Berkshire’s corporate structure. Treasury touches on this dynamic in a footnote at the bottom of page 2:
Note that this evidence may seem to suggest at first glance that at least a portion (e.g., perhaps 56% x 35% = 20%) of the rise in the top-1% income share could reflect merely a change in how business income is reported on Form 1040 returns: before annual business income taxes (as pass-through income subject to ordinary individual income taxes) rather than after annual business income taxes (as post-corporate-income-tax dividends or capital gains distributions).
Figure 2 at the back of the paper helps illustrate this dynamic.
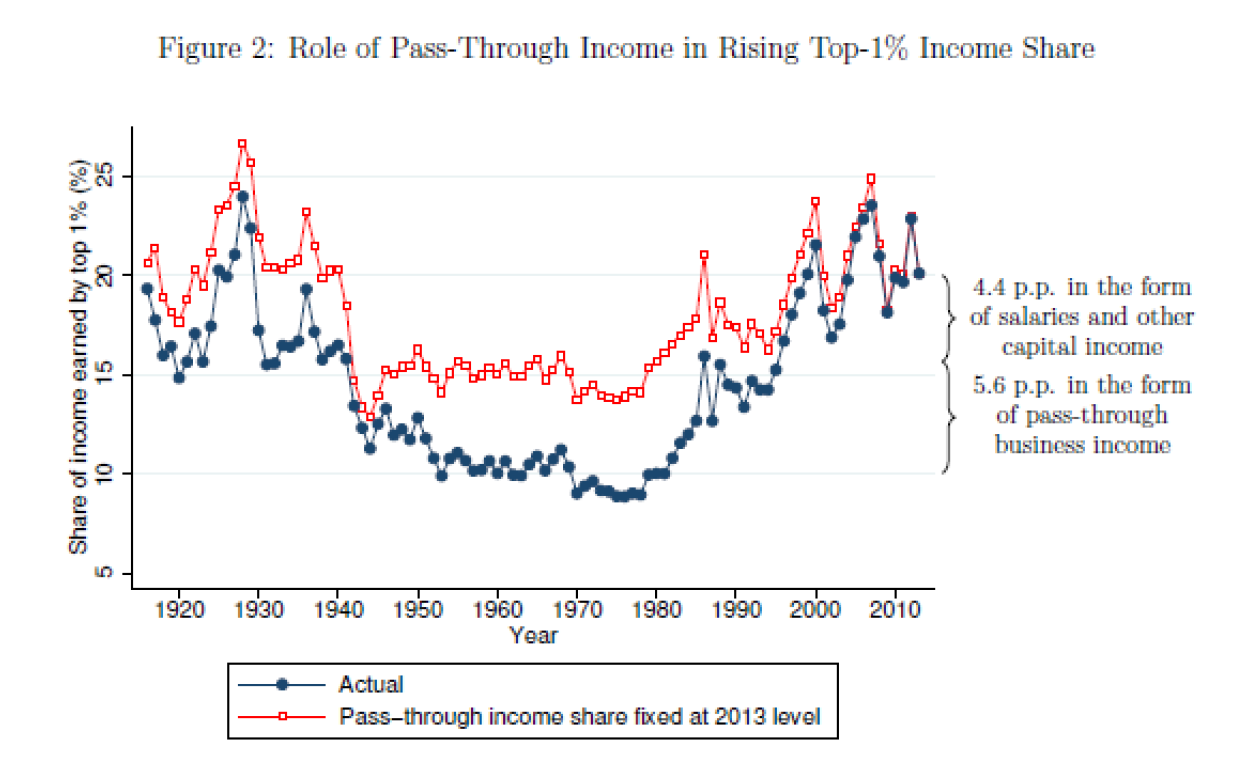
The blue line shows the rise of income inequality, thanks to data from Piketty and Saez. The red line shows how much less inequality would have risen if businesses back in 1980 were taxed as businesses in 2013 – i.e. all that income showed up on the individual tax forms rather than the corporate ones. Lesson: C corporation taxation masks income inequality.
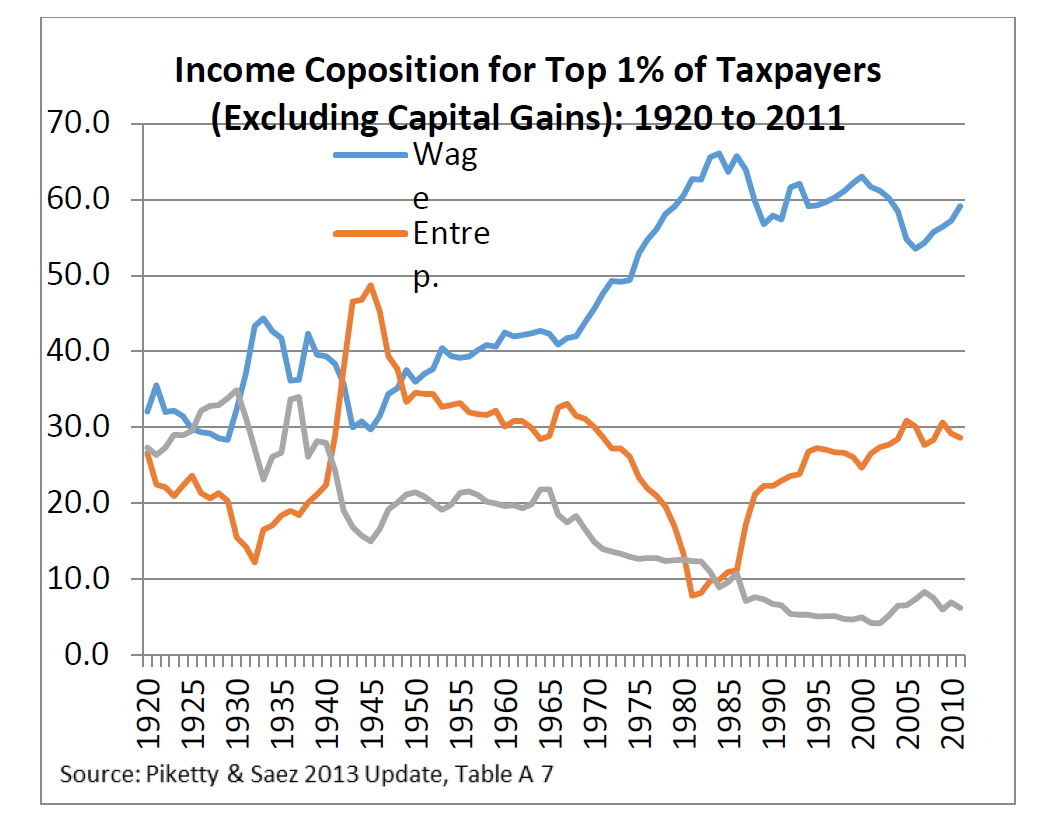
Here’s the underlying data from Piketty and Saez. Notice how the “entrepreneurship” income bottoms out right when Ronald Reagan began cutting marginal rates on individual and pass through businesses in 1981? A large part of the perceived growth in upper incomes is really just an accounting shift from corporate to pass through tax reporting.
The second assertion is that Treasury would collect $100 billion per year in revenues if C corporations were still the dominant business type. Here’s the study:
If pass-through activity had remained at 1980’s low level, strong but straightforward assumptions imply that the 2011 average U.S. tax rate on total U.S. business income would have been 28% rather than 24%, and tax revenue would have been at least $100 billion higher.
We’ve pointed out in the past that the migration of businesses from the inefficient corporate tax to the more efficient (and equitable) pass through structure has been a boon to the American economy and workers. As our 2011 EY study made clear, there are more businesses, higher levels of capital, and more jobs because of pass through taxation.
Measured against the overall economy, the business sector today is literally bigger than it was before the 1986 tax reform opened the door to pass through taxation. Tax Foundation numbers show that business income made up 9 percent of GDP pre-1986 (8 percent corporate income and 1 percent pass through). Today, business income makes up 11 percent of GDP (5 percent corporate and 6 percent pass through).
So if you are going to revert back to pre-1986 shares of business income, don’t you need to revert to the smaller economic footprint as well? That would mean expanding the application of the corporate tax to more business income, but also shrinking the total business tax base by about 20 percent. That adjustment would effectively wipe out any prospective revenue gain. Add in today’s higher tax rates on pass through businesses and it is possible the Treasury approach would lose revenue.
The study recognizes the inherent weakness of the $100 billion estimate:
We stress that this exercise is not a projection for the likely effects on tax revenue from business tax reform. It is mechanical and assumes no behavioral responses, but has the advantage of being transparent.
Transparent it might be but, unfortunately, this nuance was lost to the popular press. Beyond these two key points, here are other thoughts regarding the report:
- The new study uses 2011 filings and tax rules, so it misses the sharp rate hike on pass through businesses that took effect in 2013. That change alone should dramatically raise the resulting effective rates on S corporations and partnerships.
- Despite employing pre-2013 rates, the study finds that S corporations pay the highest average tax on their income (25 percent vs. 22 percent for C corporations) before shareholder-level taxes are factored in.
- The study then assumes shareholder-level taxes add another 9 percentage points to the C corporation average rate, but that assumption is based on economic literature from 2004 rather than tax collections from 2011. It also employs heroic assumptions about the composition of corporate distributions (Footnote 16). Definitely worth further review.
- For partnerships, the study fails to differentiate between active business income and investment income, which is obviously taxed at lower rates. The study notes that 70 percent of partnerships are “finance and holding companies.” To the extent these partnerships are investing in C corporations whose income is already taxed at the entity level, it makes sense that their effective tax rate would be lower than the top statutory rate. Perhaps this partnership income should be included in the C corporation bucket, since they are C corporation shareholders?
- The study attributes twenty percent of the partnership income to “Unidentified TIN type” and “Unidentified EIN.” It then appears to assume this unidentified income was taxed at a blend of the two lowest applicable rates, resulting in an even lower average rate for partnerships. As with the C corporation shareholder assumptions, definitely worth a further look.
These are just our initial reactions to the Treasury report. We will have more to say in the future. The report was written by serious people and it deserves a serious response. But the news cycle doesn’t follow the academic calendar, and the study’s emphasis on income inequality and revenue gains are driving numerous news stories today. So it was important to remind our members that this study is not the last word in pass through taxation.
You’re Going the Wrong Way!
A new Tax Notes piece from University of Michigan law professor Reuven Avi-Yonah raises an important question about proposals to force large private businesses to become C corporations: What exactly are we trying to accomplish here? As Avi-Yonah notes:
This fiscal illusion [that corporations bear the cost of the entity-level corporate tax] allows politicians to raise taxes without justifying increases to the voters who pay them. That lack of accountability violates the principle of no taxation without representation, a foundational concept found in the Declaration of Independence and underpinning the Constitution’s origination clause.20
Given the corporate tax’s complexity and the transaction costs it imposes both taxpayers and the IRS,21 it should be eliminated unless a better justification exists than voters’ misperception of who ultimately bears the corporate tax burden. Most of the traditional arguments for maintaining the tax are unconvincing, as is the Tax Law Center’s proposal to expand it beyond what is strictly necessary.
The piece specifically responds to a recent paper from NYU’s Tax Law Center and the Hamilton Project proposing to force partnerships and S corporations with more than $25 million in annual receipts to become C corporations. The authors claim this reform would eliminate disparities in the code while raising revenue.
Are there any flaws here? How much time do you have?
Let’s begin with our observation that the traditional corporate double tax does not apply evenly to all business types. As we’ve covered many times before, most public company earnings today avoid the second layer:
[T]he 39.8 percent C corporation rate cited is the combination of the new 21 percent corporate rate and the 23.8 percent tax on capital gains and dividends. That is what a C corporation would pay if 1) all the shareholders of the corporation were fully taxable and 2) all the earnings of the corporation were distributed in the same year as they were earned.
But most C corporation shareholders don’t pay taxes, or they pay sharply reduced tax rates. According to the Tax Policy Center, the share of U.S. corporate stock held in taxable accounts has fallen from more than 80 percent in 1965 to about 25 percent in 2015.
You know who does pay the full double tax? Private companies forced into C corporation status. That’s because all S corporation shareholders are – by definition – fully taxable individuals or trusts. These family businesses do face the full double tax when their profits are distributed or when the business is sold. So forcing them into the double tax would punish them and give larger public companies an even greater advantage than they enjoy now.
The disparity between public and private companies raises another important flaw in the paper – the $25 million threshold. As Avi-Yonah notes, it’s wholly arbitrary.
The parity issue is problematic, because it’s unclear why a partnership or S corporation with over $25 million in gross income is more like a C corporation than a smaller partnership or S corporation. The current dividing line is that almost all publicly traded entities are taxed as C corporations. That makes sense because in most cases, it is impossible to attribute their income to ever-changing shareholders.
He’s right. The true line of demarcation in business operations is not some arbitrary revenue level, but public versus private ownership. Public companies operate differently in nearly all aspects of their operations. If you must divide the business community into two, why not start there?
And while $25 million might seem like a lot, it is actually very low. According to FMI, the average supermarket generates roughly $35 million in annual sales yet earns just 2.1 percent in profits. That’s about $730,000 a year, hardly the stuff of corporate giants. Contractors, fuel retailers, and distributors face similar margins, while the Small Business Administration recognizes firms with receipts of $40 million or more as small businesses.
Which brings us to another flaw. The authors argue that their plan would ease tax administration, as complex partnership structures can be difficult to audit. (We’ve written about audit hysteria in the past.) S corporations, however, operate under a different set of rules than partnerships. Those rules limit S corporations to one class of stock and a narrow universe of eligible owners. As a result, S corporations are literally the opposite of complex – they are simpler to audit than either partnerships or C corporations and forcing them to convert would make tax administration more complex.
Despite this, the proposal would fall heaviest on S corporations. The paper estimates that 83,000 businesses would be forced into the corporate tax system, roughly two-thirds of them S corporations.
The paper acknowledges this disconnect, conceding that large S corporations “may not present the administrative challenges” motivating the proposal. It even explores an alternative approach that could exclude S corporations altogether. Avi-Yonah addresses this issue, writing:
If the current partnership tax rules render this task too onerous, the solution lies in simplifying the rules, not expanding entity taxation… the solution is not to subject both large partnerships and S corporations to subchapter C. Instead, subchapter K should be made more like subchapter S, and subchapter S should revert to its original form.
We don’t always agree with Avi-Yonah, but his suggestion to simplify partnership taxation by borrowing from the S corporation rules moves in the right direction. S corporations for everybody, is what we say.
The broader problem is the direction of the tax policy debate. So many recent proposals begin with the assumption that more businesses should be taxed as C corporations. As Avi-Yonah notes, the authors of these proposals need to rethink this basic premise. Like the guys in “Planes, Trains, and Automobiles,” they are going the wrong way.
SCOTUS Punts on CTA Challenge
The Supreme Court today declined to hear two challenges to the Corporate Transparency Act, including NSBA v. Bessent, leaving in place an Eleventh Circuit ruling that upheld the law last year. The Court also denied review in Texas Top Cop Shop v. Blanche. S-Corp had backed both challenges, and earlier this year helped lead a broad Main Street coalition urging SCOTUS to take them up.
Today’s news is unfortunate, but the fight over the CTA is far from finished. Numerous legal challenges to the law remain pending, meaning the constitutional questions surrounding the CTA are likely to make their way back to the Supreme Court. We will just have to wait until other circuits weigh in on the substance.
Fortunately, the announcement leaves unchanged the current filing obligations of Main Street businesses. Treasury’s recent final rule exempting domestic entities and owners from the CTA remains in effect and FinCEN has committed to purge the database of the personal information it collected under the previous rules.
This relief is welcome, but it’s also regulatory in nature and is only as durable as the administration providing it. A future Treasury Department could reverse course and once again subject tens of millions of small and family-owned businesses to the CTA’s reporting regime.
That’s why Congress needs to finish the job. Legislation like Representative Warren Davidson’s H.R. 425 would codify the domestic exemption and ensure Main Street businesses never again face the CTA’s costly and unnecessary reporting requirements.