
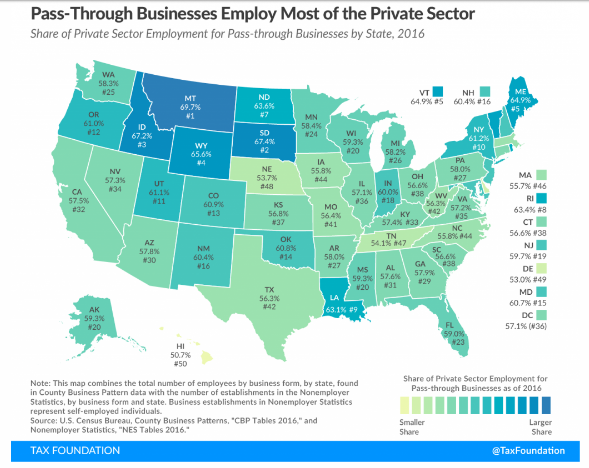
The Tax Foundation has updated some of their data on pass-through businesses last week, including this nice map with state-by-state data on the percentage of jobs from pass-throughs, which is helpful. As before, it shows that pass-through businesses employ the majority of private sector workers in every state of the country, including seven out of ten workers in Montana!
On the other hand, this map purporting to show the marginal rates paid by pass-through businesses by state appears to illustrate only a small subset of pass-through businesses, and those towards the bottom end of the possible marginal rate range to boot.
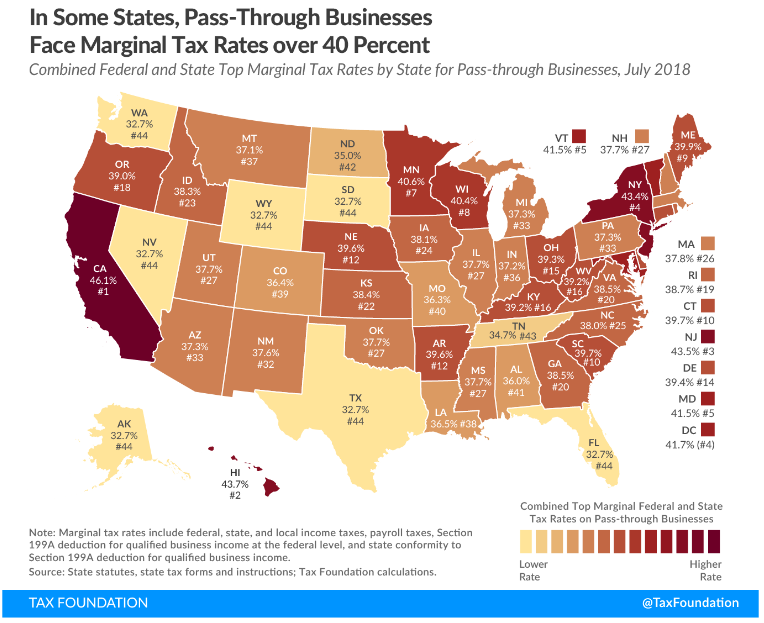
Backing out the numbers, it appears that the Tax Foundation based their rates on a general partnership or sole proprietorship that enjoys the full 199A deduction and is able to deduct a portion of the wage taxes they pay on the business’ profits. Using Wisconsin as the test case, here is the math:
 What are our concerns with this approach? For starters, it is clear that these rates only apply to businesses that qualify for the full 199A pass-through deduction. As tax folks know, many pass-through businesses qualify for only a partial deduction, while others get no deduction at all:
- Pass-through businesses operating in the wrong industries – health, law, accounting, consulting, etc. – are labelled “Specified Services Trades or Businesses” (SSTBs) and precluded from any deduction.
- Other pass-through businesses are subject to “guardrails” that limit the size of their deduction to 50 percent of the wages they pay or a combination of wages and return on qualified capital.
- Finally, pass-through businesses with international income have that income excluded from the pass-through deduction.
For those businesses, their marginal rates are significantly higher than those represented on the map. Using Wisconsin as the sample state, the top marginal rate for a partnership SSTB is:

This is important because, unlike FICA and self-employment taxes, no portion of the NIIT is deductible. So an active shareholder of an S corporation operating in Wisconsin pays 3.1 percent less than the rate paid by an active partner would, while a passive investor shareholder in that same S corporation would pay 0.7 percent more, 48.45 percent versus 47.75 percent.
Other details are lost on the Tax Foundation map. For example, S corporations do not pay wage taxes on their business profits, but they may be subject to the 3.8 percent Net Investment Income Tax (NIIT) implemented to help pay for Obamacare. That tax applies to S corporation owners who do not actively work in the business.
These wide variations in outcomes are one of the challenges we face in explaining the impact of tax reform on S corporations, and why we use the line graph below to illustrate the range of possible rates for both pass-through businesses and corporations. (Top rates on C corporations vary depending on their dividend policies and the tax profile of their shareholders.)

Our line graph reflects only federal taxes. As the Tax Foundation map shows, state taxes make a big difference as well but, again, their map misses some key nuances. For example, while C corporations may continue to deduct their state income taxes in full, most state income taxes (ranging up to 13.3% in California) are effectively nondeductible for pass-through business owners. The loss of the deduction shows up in the pass-through businesses’ tax base, however, not the rate.
So for businesses in low tax states that get the full 199A deduction, they might see the lower overall tax rate reflected on the map and achieve something that approaches rough parity with the typical C corporation. Specified services businesses operating in high tax states, on the other hand, are not even close to parity and likely saw their overall tax burden go up.
So the Tax Foundation needs to correct their map, or at the very least make clear that the illustrated rates reflect only one, and close to the best, possible outcome for pass-through businesses. Many pass-throughs will pay rates significantly higher than what is on the map. The highest marginal rate paid by a California S corporation that is an SSTB and has passive shareholders is not 46.1 percent, its 54.1 percent.