Home/Uncategorized

Perception v. Reality on Tax Rates

Here’s a conundrum.  A recent poll revealed that 76 percent of Americans support increasing taxes on the “wealthy,” while sixty-one percent support the wealth tax proposed by Senator Elizabeth Warren, which is like an income tax, only at ridiculously high rates.

But polls also show Americans consistently oppose high tax rates, even on the wealthy.  This summer, for example, the Winston Group asked registered voters: “For each of the following, what is the maximum rate at which you think they should be taxed?”  …[T]he average responses were all consistently low, ranging from a high of 31 percent for the

(Read More)

2019-09-09T15:44:51+00:00September 10, 2019|

Failure of High Marginal Rates

Earlier this year, the Congressional Budget Office produced a report reviewing tax rates on labor income since 1962 that includes some important lessons for tax policy folks.

The first lesson is that nothing replaces a really cool chart.  Take this heat map, for example.  What a great way to convey a lot of information all at once.  If you’re a taxpayer, the simple way to view it is lighter colors good, darker colors baaad.

Our second lesson is how much more progressive the tax code has become since the 1960s.  Back then, nearly

(Read More)

2019-08-28T16:43:54+00:00September 3, 2019|

Treasury on 199A Guardrails

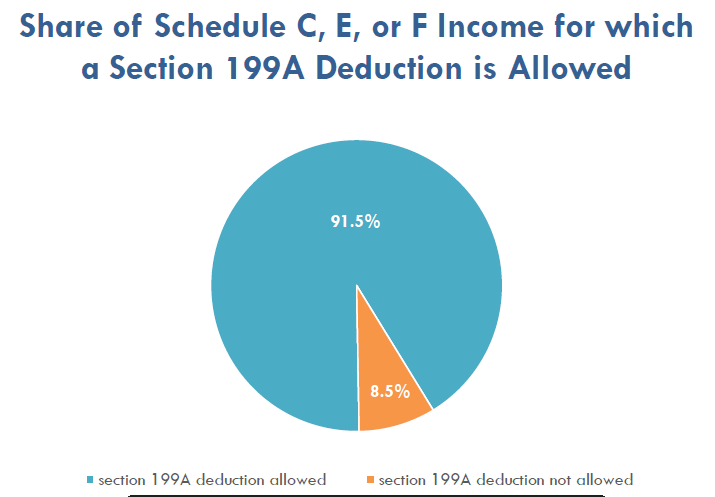
Remember this JCT chart from earlier this year?  It garnered lots of attention and called into question how the 199A pass-through deduction was structured.  If only 9 percent of all pass-through income was disqualified from getting the deduction, what was the point of having all those complicated rules?

We wondered about the estimate at the time, as it didn’t comport with our member’s experience.  In our S-CORP survey this year, only half of our members expected to get the full deduction, while rest expected just a partial deduction or no deduction at all.

(Read More)

2021-08-16T14:01:00+00:00August 27, 2019|

S-Corp Member Survey 2019

S-Corp sent its members a new survey this Spring.  The goal was to follow up the survey we did just after tax reform was enacted to see how things had evolved.  Now that our members had a year to digest the new rules, where did they stand?  Here are the key takeaways –

  1. Seven out of ten say their taxes went down or stayed about the same;
  2. Four out of five say making permanent the 20-percent 199A deduction is a priority; and
  3. Seven out of ten plan to remain S corporations in the near future.

That’s not bad, considering where we

(Read More)

2019-07-30T15:41:30+00:00July 30, 2019|

The Myth of Corporate Decline

The visual economist issued another great chart last month, this time showing the largest public companies by market cap.

Our first reaction is, wait, Microsoft is number one?  When did that happen?  All the focus on FAANG stocks (Facebook, Amazon, Apple, Netflix and Google) and stodgy old Microsoft is bigger?  Go figure.

Our second reaction is “Gee Grandmother, what big market caps you have.”  These companies are huge!  And that’s not limited to the ten companies illustrated here.  Measured against GDP, the market cap of all public companies in the US has

(Read More)

2019-07-26T16:50:37+00:00July 26, 2019|