
The elections are less than a month out, and the implications for S corporations are huge. If Democrats retain control, we can expect two more years of policy risk, with the threat of higher rates and increased estate tax levies looming large. If Republicans take either the House or the Senate, we can expect two years of divided government, with limited opportunities for tax policy to move and the focus shifting to the policy cliff taking place at the end of 2025.
So what will it be? Here’s how we think things will play out.
Macro Trends
Let’s start with macro trends. Earlier this month, the New York Times ran a piece entitled, “It’s Time to Take Democrats’ Chances in the House Seriously.” Their thesis centered on a couple generic congressional ballots showing that voters in the aggregate slightly prefer Democrats over Republicans for Congress. But those ballots appear to be an outlier. Real Clear Politics publishes an average of three key metrics – the generic ballot, Presidential approval, and right track/wrong track, with each showing Republicans are ahead:
So the macro outlook favors Republicans. So does the history of mid-term elections, where the President’s party has gained seats in the House only twice in the last century. As NPR observed during the 2014 elections, “History tells us that midterm elections are bad — sometimes very bad — for the party that controls the White House.” There are exceptions, but this year doesn’t appear to be one of them.
House
In the House, Democrats face a challenging landscape and will need to significantly outperform the current outlook if they are to hold on to the majority. Here’s the latest summary from Cook Political Report:
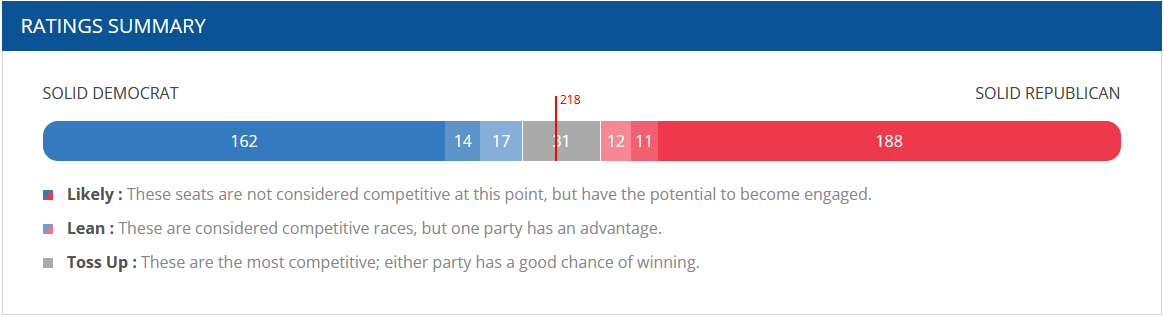
According to Cook, 211 seats at least “Lean Republican,” including 9 Democratic seats. Compare that to the 193 seats that at least “Lean Democrat,” only two of which are Republican seats. That suggests the Democrats would need to win 80 percent of the 31 “Toss Up” races (24 out of 30) in order to hold onto their current majority.
FiveThirtyEight offers similar projections, with their model generating the following odds of a Republican majority come next year:
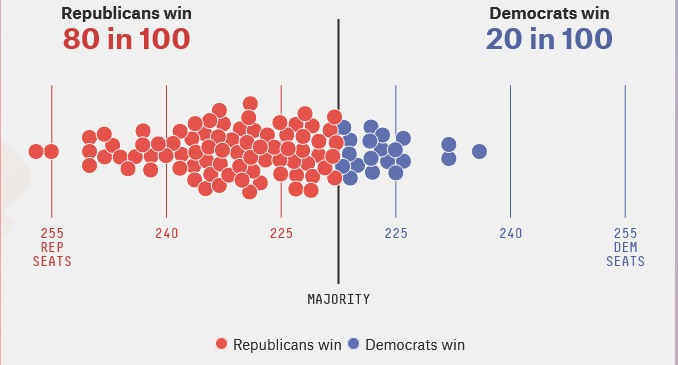
So their model says there’s a 80 percent chance Republicans take the House, with the most common scenario resulting in Republicans controlling between 225 and 230 seats.
Finally, Real Clear Politics shows an even larger Republican advantage. They start with 221 solid or Republican-leaning seats, with 38 toss-ups. Split those down the middle and you have Republicans with somewhere between 235 and 245 seats next year. If this is a wave election (as many predicted earlier this year), then the toss up seats will mostly break one way, meaning 245-250 seats for Republicans.

The bottom line here is that even absent a “Red Wave”, it’s hard to plot out a scenario where Democrats emerge with their majority intact. The betting markets agree, showing the odds of Republican control at 88 percent.
Our take: Republicans net 33 seats, for a 245-190 majority
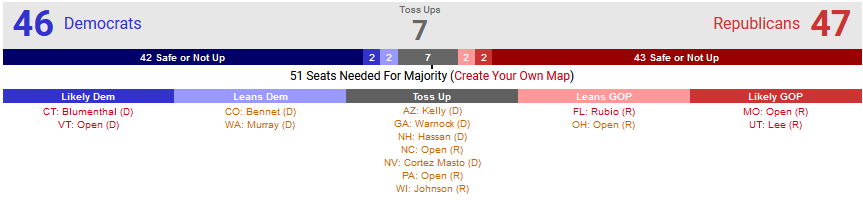
The Senate is where things get a little more interesting. Cook lists four seats as “Toss Ups,” split evenly between both parties: Pennsylvania and Wisconsin for the Republicans and Georgia and Nevada for the Democrats. Cook also ranks the three battleground races in Arizona, Colorado, and New Hampshire as “Lean Democrat” with two races – North Carolina and Ohio – as “Lean Republican.”
That’s about as close as it gets. Yet FiveThirtyEight puts the Democrats’ odds of holding onto their 50-seat majority at nearly six-in-ten:
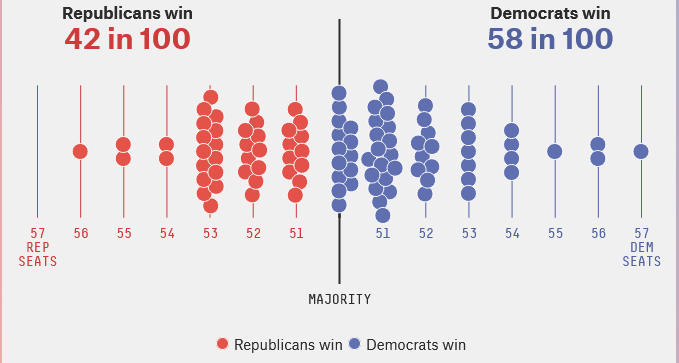
We think that’s a stretch, and that 538 is in danger of repeating its misses in recent cycles. Instead, our view is more consistent with the RCP outlook, showing Republicans starting with 47 safe, likely or leaning seats and winning 5 more, resulting in a three-seat gain overall.
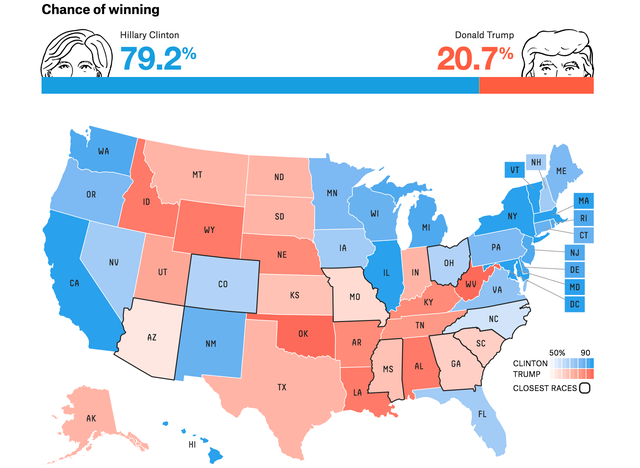
How does RCP get there? They start with their average of current polls, but then adjust those results to reflect polling misses in the past three cycles. For example, Pennsylvania polls at this point showed presidential candidate Hillary Clinton with a 6.2 percentage point lead over Donald Trump, but Trump eventually won the state by 0.7 percent. Similar misses occurred in 2018 and 2020, suggesting the Pennsylvania polls are off by an average of 4.8 percent. That adjustment would give Dr. Oz a 2.4 percent lead on election day.
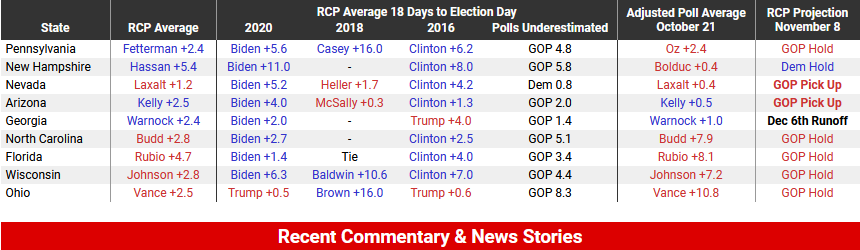
The table above shows similar adjustments in other battle ground states. What’s interesting is that while the polls laughably undercounted Republicans in North Carolina and Ohio, the math works the other way in Nevada, where recent polls have tended to undercount Democrats. After the adjustment, challenger Laxalt still shows a small lead, but it’s going to be very close.
If the RCP analysis is accurate, and we think it is, then expect Republicans to have a good election night and come away with a comfortable Senate majority.
Our take: Republicans net a total of 3 seats, for a 53-47 majority
So that’s our outlook for the upcoming elections. We’re three weeks out and lots could change, but our base case for now is Republicans win the majority in both bodies and we have divided government for the next two years. We’ve been wrong before, so you never know, but for Democrats to retain control they would have to overcome recent polling, the current macro outlook, and the history of mid-terms. That’s a tall order, and it doesn’t appear likely.
Our next update will focus on the policy implications of the elections, and what divided government might mean to Main Street.